The indices had a significant 3rd quarter this year. According to Hurst’s bandpass filter analysis they have established the most recent 4 year cyclical high.
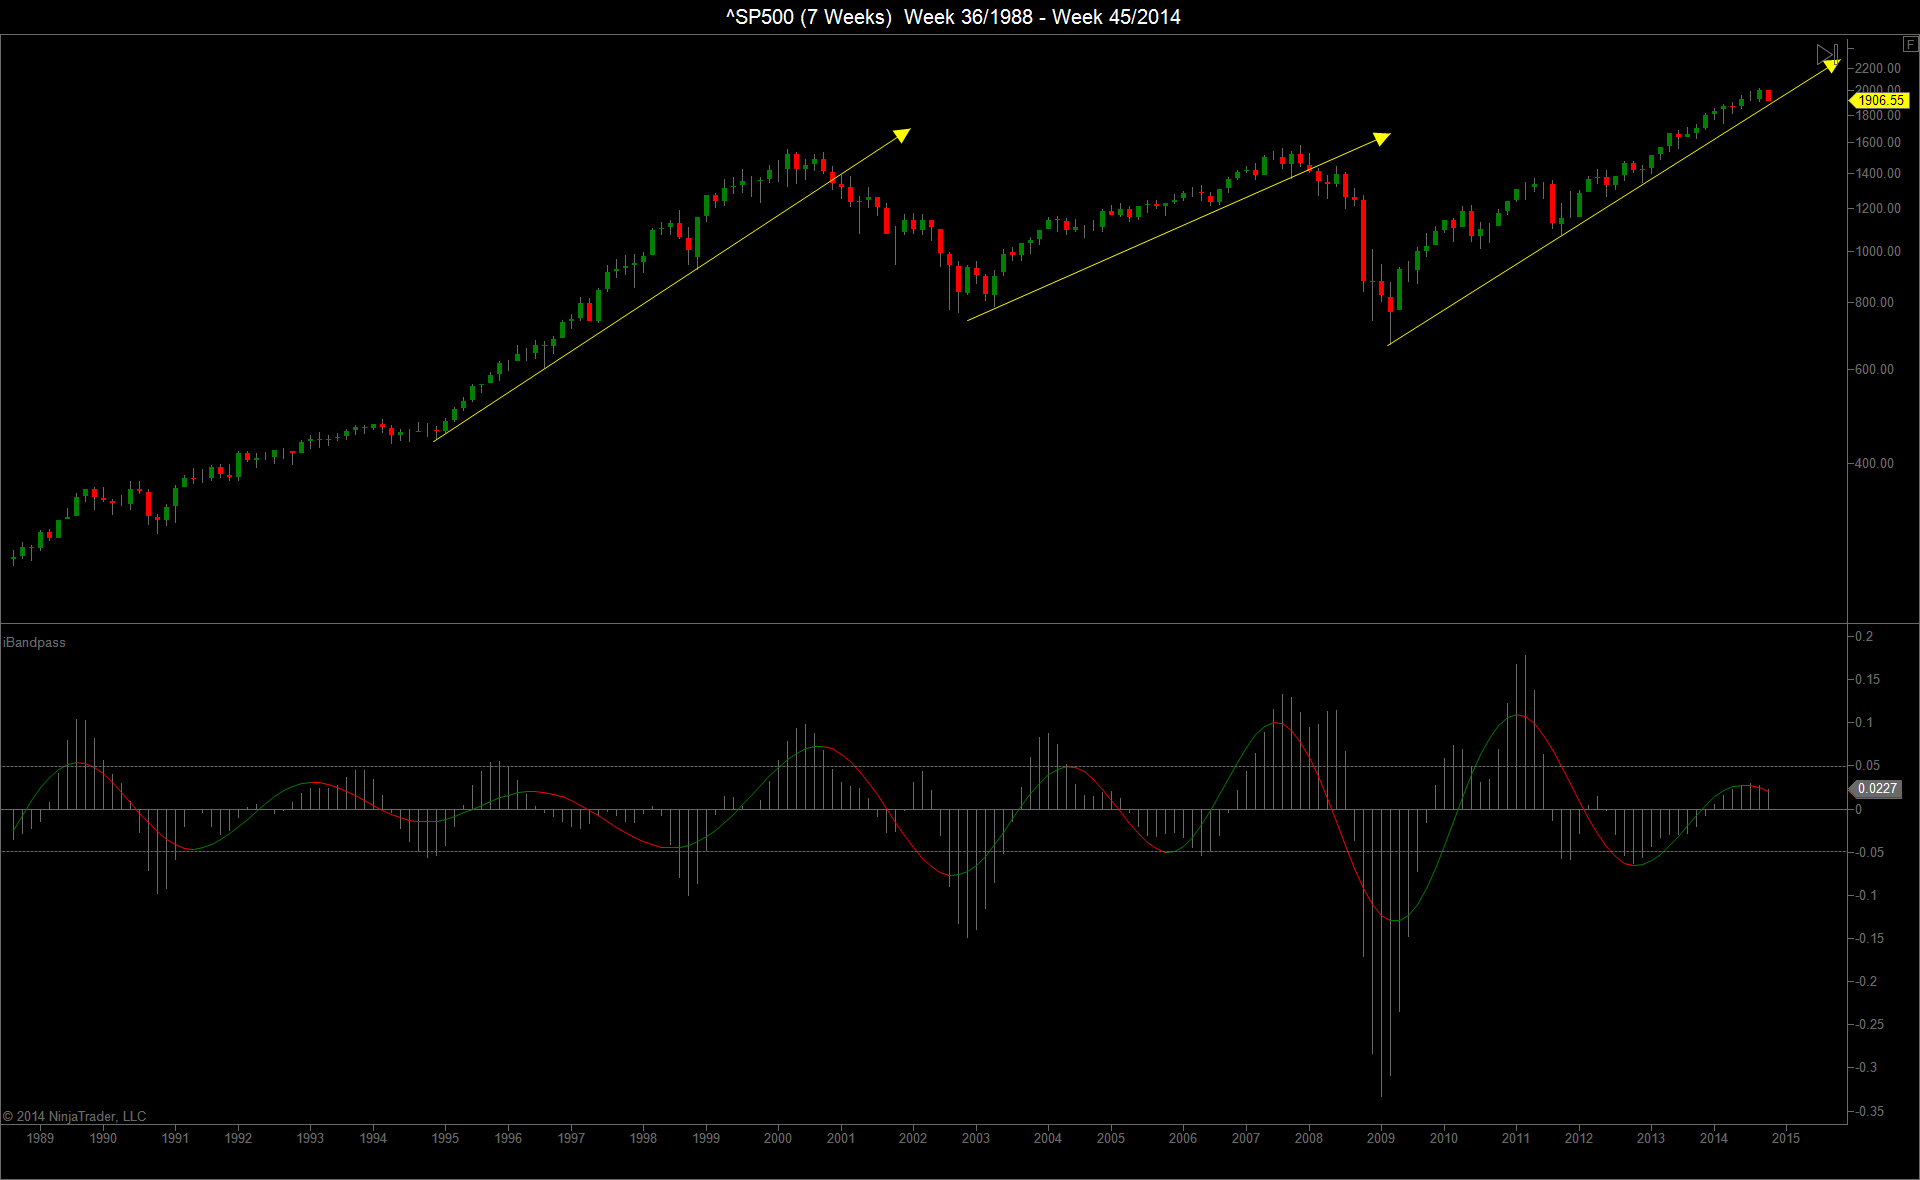
Below is a chart of the S&P 500 showing the 4 year price wave dating back to 1990. It has clearly crested and is currently cycling down.
Here is the same chart of the Dow.
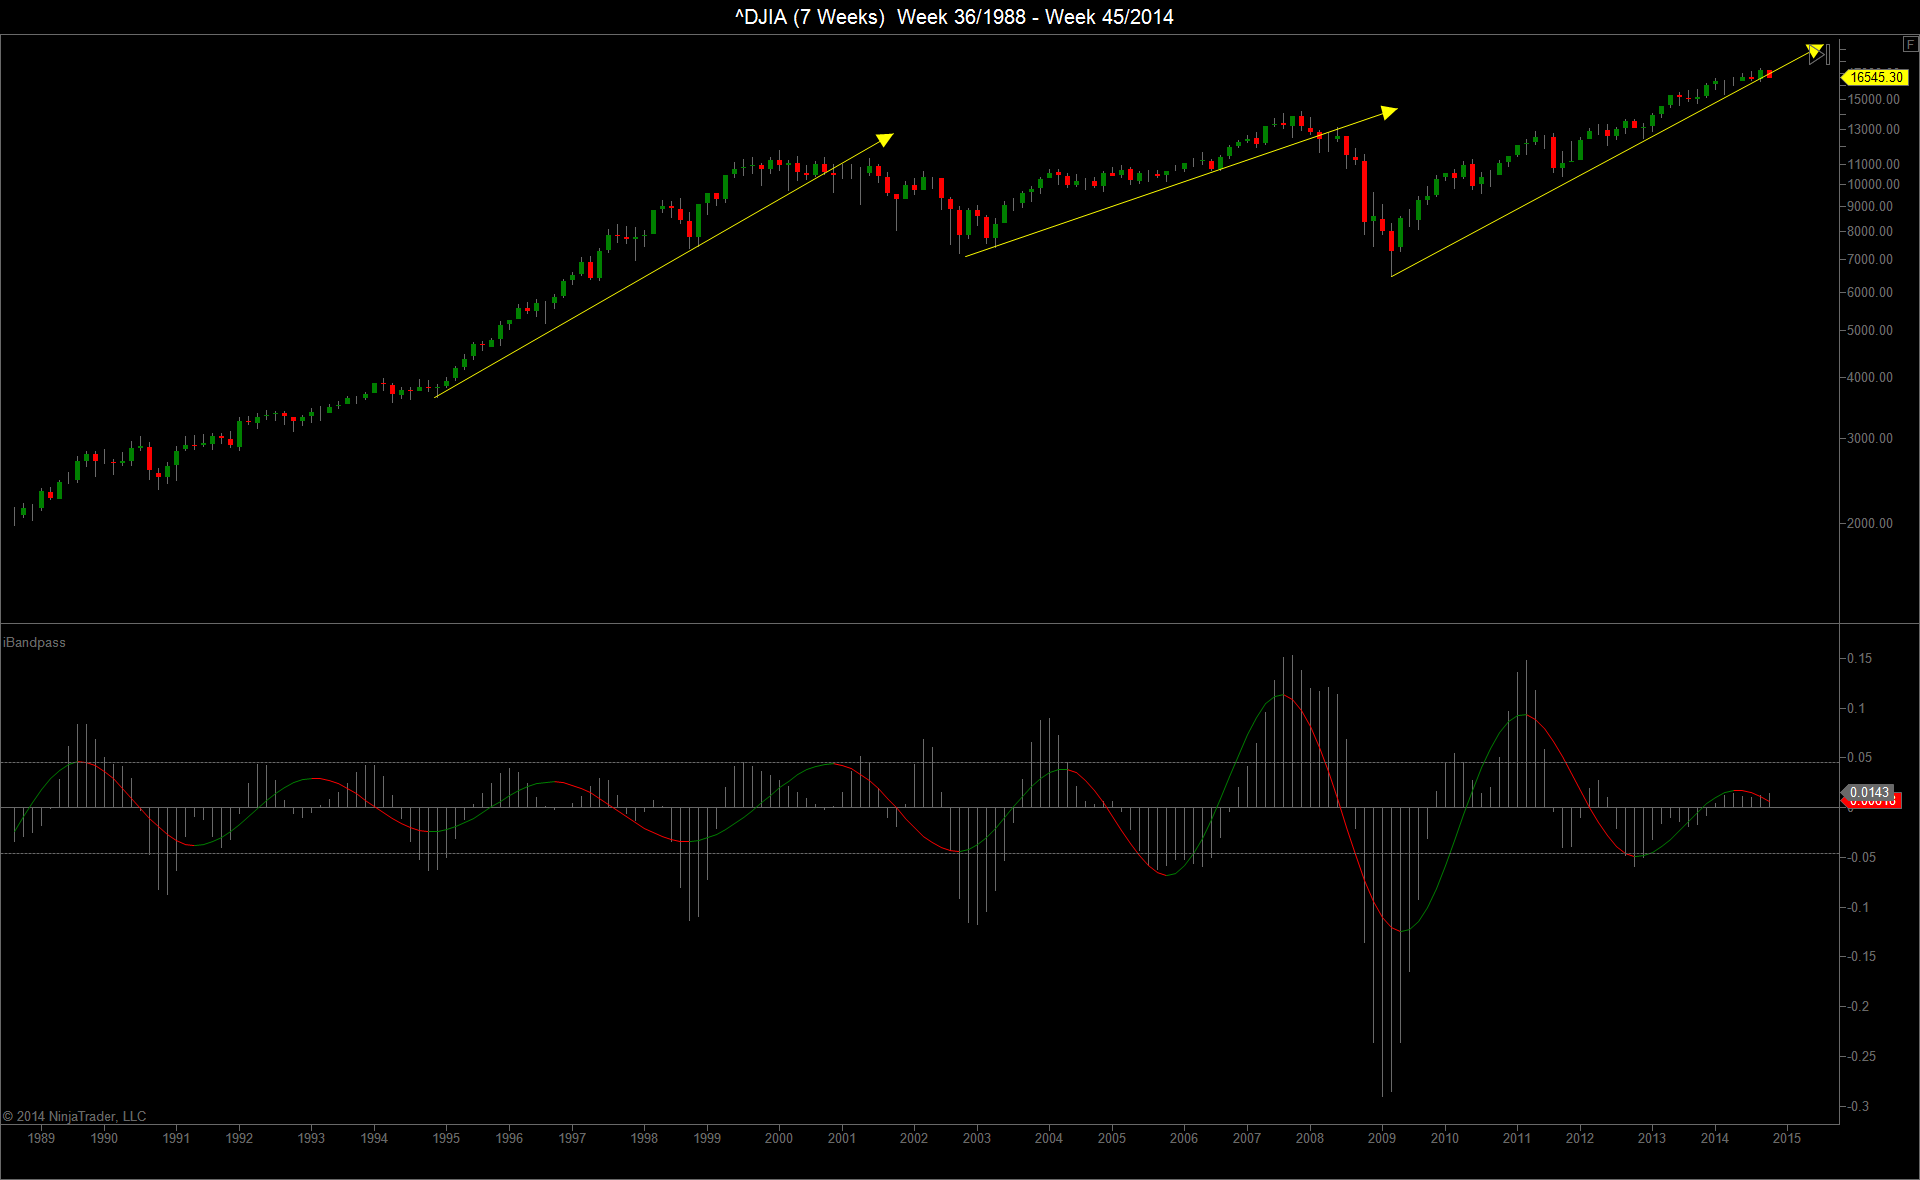
Included on the charts are the 4 year wave VTLs. Historically (114 years) when the 4 year wave VTL (log scale) is broken to the downside, the price action retraces to or below the prior 4 year low 100 percent of the time! In one third of those declines the price action retraced below the prior two 4 year lows! Statistically that implies the indices are on the verge of very significant declines.
One of the more reliable indications that an 80 week and 4 year high has formed is the formation of a lower 20 week high. Below is a weekly chart of the ES futures showing the 20 week wave dating back to the 2007 high. The red arrows show the formation of lower 20 week highs at the 4 year cyclical highs followed by significant price declines. Also included on the chart is the 4 year VTL and ostensibly the 40 week VTL, both of which have been broken to the downside.

Below is a zoomed look at the above chart showing the 20 week wave cycling into a low. The price has already closed below the prior 20 week low close and there are still a few weeks before the next 20 week wave low is due based on its average period. This same analysis performed on the Russel 2000, the NYSE Composite Index, and the Value Line Index (geometric) indicates that a lower 20 week high has already formed.

It appears that the S&P 500 is the last man standing. From a probabilistic standpoint, the formation of a lower 20 week high in the ES will indicate that significant declines are in the future and the possibility that the indices have formed multi-year highs due to the fact that the next 4 year low is not due until 2016.


10 thoughts on “4 Year Cyclical High”
William are you generating theses analyses with ninja trader software or Hurst software? I cant get my 20 week wave analysis to go back more than 3 cycles? Maybe my EOD software does not have an extension feature? What about the bandpass filter is that Sentient trader, Ninja or something else. I was noticing the same things with the 20 week peaks just looking back at previous tops in 200 and 2007. I use time symmetry techniques and they called for a peak October 1,2014 using monthly timing with a 20 day margin of error on either side of that date and voila. So I am in agreement with a significant bearish outlook here. I enjoy your commentary and thank you for this contirbution. I included a chart with my time symmetry and projections based on this analysis.
I forgot to add that that are projections to the right of the chart using Williams observation of hitting a low of the past four years indicates 1265.00 as that target. with extensions beyond that of 1075 and 1010 lows.AT present moment those 2016 lows are likely to occur during the first quarter of 2016.
Hi Jeffrey
I use NinjaTrader to create those charts. However you can create something similar in ST with a little ingenuity. The visual effect with the semi-circles is quite stunning!
Your time symmetry analysis seems to be drawn from the work of the late Terry Laundry. I did an analysis of his work going back about 40 years and the correlation to Hurst’s work is very obvious. I use a similar symmetry approach by counting the number of oscillations of a shorter wave from high to high, high to low, and low to low and project that in to the future +/- one oscillation. I find that to be much more accurate than just projecting the average period of the wave in to the future because the filter output compensates somewhat for the duration fluctuations over long periods of time.
Hi William. It is very interesting to see the longer term picture. Things are definitely looking bearish!
I like to trade the 40 day FLD and here is my chart that I use that is very similar to David’s. I think I have the 40 day trough pinned into a Sept 15th low is the only difference. I have been counting the November 2012 low as a 54 month trough for quite awhile but up until recently the cycles were not resolving very well into trough structures we would expect to see. We are about to make a short term 80 day cycle trough and I would hypothesize that any rally out of that trough will form the lower 80 day cycle peak and confirm we are headed much lower. The overall cyclic trend may be a -4 also because this would likely have been the high of the 18 month cycle as well. I wonder why Sentient trader would not mark it as such?? Any way, It great learning so much about things and having this blog to share. Thank you David.
Hi Jeffrey. It’s a pity we cannot zoom into images attached to comments, my eyes aren’t as good as they used to be! But I think that you are asking why ST still considers the 18-month cycle as rising when there is strong evidence that the peak has already formed.
That is a very interesting discussion actually, and it has to do with the difference between the actual “cycle” (the “thing” that is pushing price) and the resultant “effect” of that cycle on price. We usually speak (or write) about the positions of cycle peaks and troughs as they manifest in price – in other words where we can see them on the chart. But in the cyclic model table that you show in your image, Sentient Trader presents the current direction of the underlying cycle. That underlying cycle is the line that you see in William’s bandpass filter charts (and of course ST uses a bandpass filter at the beginning of the analysis to determine the expected current status of those cycles).
We know that there are two peaks in price for each cycle peak (the M-shaped cycle), but the underlying cycle has only one peak. You are absolutely correct that the peak that has formed in price is most probably the highest peak we will see in the current 18-month cycle, and therefore we will look back and recognize that peak as the peak of the 18-month cycle, but the underlying cycle (those smooth regular curves shown on William’s charts) is in fact still moving up, and will turn down at about the time of the 40-week cycle trough.
It is an interesting example of why even something as simple as underlying trend can be calculated differently by different analysts. Sentient Trader takes the “pure” approach of considering a cycle to be moving up until halfway through its wavelength, whereas many analysts would take the approach you suggest of considering it to have turned down once a peak has formed in the market, if the second peak is not expected to be higher.
Hello David, try the right button of your mouse and choose “view image” to zoom in, this works with me.
Hi David.
Beautiful explanation! I hope what readers will take from it is that fact that although the approaches are slightly different, the end result basically will be the same (assuming both approaches use similar nominal models).
Very nice work William. It shows clearly the August low as the 40 week low. However, I suspect by the time we see the next low, it will be hard to get Sentient to pin the August low as the 40 week low. Sentient will of course want to mark the coming low as the 40 week low as would most Hurst analysts. And I would simply note that the 40 week cycle is expanding in time which has bearish implications.
Your work helps to see the cycles much more clearly. Thank you for your sharing.
Thanks John.
Most approaches have a little difficulty phasing when the underlying trend changes from up to down. It usually causes pronounced frequency modulation of the intermediate waves. It is one of the signs I look for to identify major market highs.
One technique I used with ST to ameliorate this issue somewhat was to subtract the underlying trend from the data before running the phasing analysis on it. The chart will look very similar to the chart below except with the usual phasing diamonds and semi-circles. It will also add a new dimension to the look of your FLDs.