Although certainly not conclusive, I believe we are several days away from finding out whether the 20 week cycle is dominant and at this point it certainly looks like it may be. A head and shoulder formation has been forming and if the neckline is broken that would certainly put an end to the 40 week cycle dominance theory as price would be projected to head down somewhere in the vicinity of 1968 S&P 500 cash and 1955.25 futures. Of course just rough estimates based on 100% projection of the head and shoulder formation peak to trough. I disagree as suggested that the 20 week cycle low may have already occurred. This does not mean a higher high then lat May cannot be reached only that it is not likely to be as high if the 40 week cycle had been dominant. I have attached a recent look at my own 7 year cycle analysis (not sure if it is the same as Silent One’s) but this analysis indicated that the 20 week cycle low still remains ahead of us as David suggested. Anything could happen in the next few days and the neckline could hold keeping alive the 40 week cycle dominance but it certainly does not look like that will be the case as of this Friday the 13th action. As always be on you toes for whatever may happen but it certainly looks like a significant profit opportunity is at hand.

The suspected 20 week trading cycle is marked and the nest of lows outlined along with a projected low if the head and shoulder formation fulfills its 100% projection. There is some short term timing indicating a possible reversal on Monday but the most important factor is to watch whether or not the neckline can hold.


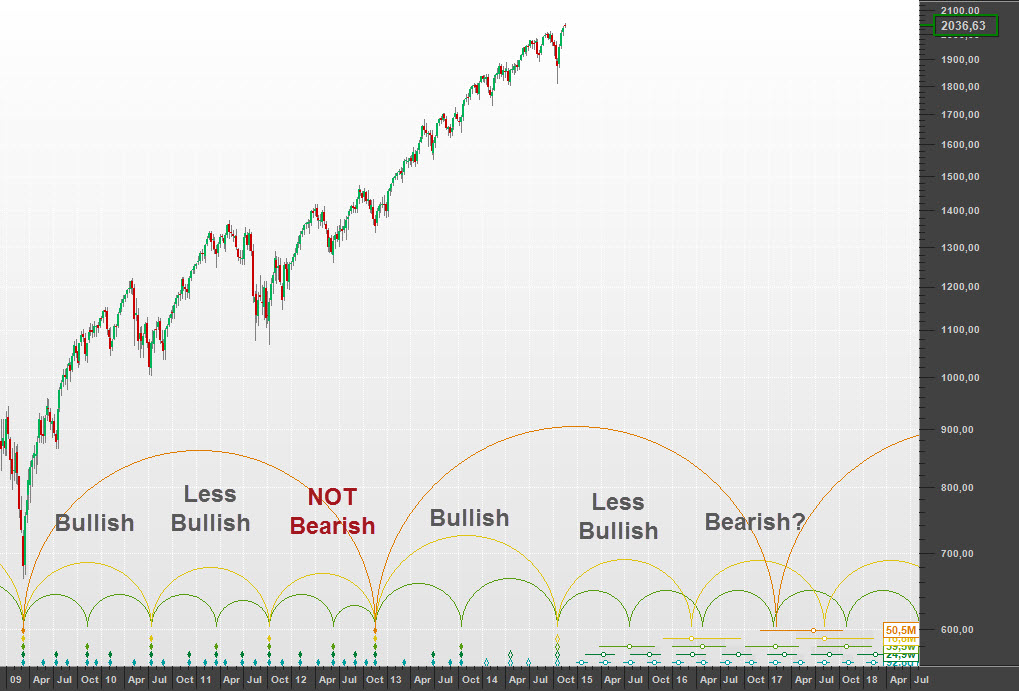
10 thoughts on “Revisiting the 7 Year Cycle”
Hi Jeffery,
Thanks for posting your thoughts on the 7 year cycle idea. I did not know that you were involved with T Theory. Very interesting work and I miss Terry’s work as I do Bob’s (airedale). There is a growing community of very skilled folks here at Hurst cycles. I am always grateful to David Hickson for developing Sentient Trader and his efforts with this website.
From a Hurst point of view, I wonder now if the $SPX is stuck in a pause zone for the remainder of the year, or at least until sometime close to the US election. The strong breadth seen in the last couple of months supports the idea of a 7 year low in Q1, and if so, rules out an imminent market collapse. However, when I look at the configuration of the FLDs for the $SPX on this weekly chart, it is hard to see how the $SPX has built any cause to move higher. The nominal 20, 40, and 80 week (17, 34, 64 week actual) FLDs are all over the place coming out of this recent low. So in fact the 20 week FLD generated a target, which was very early in the cycle and now will likely not be met. The 40 and 80 week cycles have also generated new targets that are much higher and somehow I doubt these will be fulfilled this year. So a pause zone that could take the $SPX on a ride between last year’s highs and a test of this year’s lows? Quite possible. And there is no telling at the moment if this confluence of FLDs creates a further topping zone.
But first a correction into a 20 week low is in progress and it doesn’t feel like it is very close just yet.
cheers,
john
Here is the weekly look …
daily …
Hi Jeffrey. Thanks for posting this. It is good to be reminded to keep our eyes on the classic technical patterns.
Hello Jeffrey
Do you think it is broken now, for sure?
Thanks
it is definitely broken but there is never any guarantee that it will fulfill its target. With so many people short the pattern it can esily be short squeezed at any time. I mean we rallied 25 points from the low already. That is an opportunity to go short again into what should wind up being the 20 week low within the next week to 10 day but maybe that only means a retest of today’s lows? Anyone that tells you they know where the market is going if full of it. I just make reasonable bets based on cycles and in the direction of the market trend so since the market has not likely made the 20 week low yet I want to short at least this rally.
“Anyone that tells you they know where the market is going if full of it.” – I would not be so sure, I will try my luck:)
Forget about the H&S it will not gone play out. The move lower is corrective and we have already finished zig-zag lower.
Two options finished 20 week cycle for 13 weeks or zig-zag higher and another zig-zag lower to finish bigger corrective structure 18+ weeks. Which has higher probability? – 20 week cycle low behind us with length 13 weeks.
The correction is too shallow and market breadth is not signaling important bottom so after something to the upside expect another leg lower.
To sum up – expect 3 weeks or more higher to confirm 20 week cycle low. End of June/early July another leg lower will begin, we will see M pattern and 40 week cycle low in September.
What if we have seen the lows already??
Dear David
I missed most of Monday’s webinar and would very much like to see the whole of it. Are you going to publish it on you tube or is there a link where I can watch it’
Kind regards from a wintry St Lucia, KZN
Elizabet
Hi Elizabeth. It will be uploaded soon. We have had some problems with YouTube rejecting the file, but they all seem to be resolved now. Enjoy the Natal winter!