It has now been about 45 years since J M Hurst first discovered a nominal model in cycles. That time period alone should make us wonder if it is still the same today. Perhaps if you’re talking about the monument at Mount Rushmore, you should expect little change at all. But the markets are in a state of continual flux, and so it is very likely that something is different.
This is particularly true concerning the most recent few decades. Here’s a chart which shows the market from 1950 till now. Since the prices of the S&P 500 are quite different between 1950 and now, I have made this a log chart:

From about 1990 forward, we see some unusual activity that is not been seen before. We see rises and drops of a larger magnitude. Further, the rises and drops seem visually to be more uninterrupted than before. That is to say, these rises and drops seem more to represent a pure trend, and the ups and downs representing cycles appear to be greatly diminished or absent.
So let’s look at the first Nominal Model as it appeared in Hurst’s book, “The Profit Magic of Stock Transaction Timing”. Hurst derived his timing from a Fourier analysis and a digital discovery algorithm. He declared that these two methods perfectly agreed with each other.

This chart shows the original readings he got, and the rightmost column shows his choices in creating a nominal model. I would note in passing that there are 5.7 and 4.3 years cycles shown. He chooses to represent both of these as basically 4.3. He could just as well have represented them in a nominal model a 5.7 year and 4.3 year cycle. Further, he noted that the six months and three months cycles seemed frequently combined to create an 18 week cycle.
When Hurst published his Course, he presented a new nominal model:
Hurst now emphasizes the Principle of Harmonicity which means that the cycles are multiples of each other, usually two and sometimes three. So the 3 year cycle and 12 month cycle are gone. But I have always felt there is really more than one model. A second one might be overlaid on the first, for example, 9 months, 1.5 years, 3 years, 6 years, 18 years. Maybe 12 months, 2 years, 4 years, 8 years? Indeed, we often see the “expression” of a nominal model in real data turns up unexpected cycles. Finally, there is the Sentient Trader Nominal Model:

This is just the same as the Course, not surprisingly.
So how can we recheck Hurt’s work? First, we get the same data he used, the DJIA from 1921 to 1965, or almost. In fact, my data was daily whereas Hurst used weekly. I think the Dow Jones Company, now owned by Standard and Poors, is putting on restrictions because now it seems impossible to find an online chart that goes further back than 1985. So I used daily. That shouldn’t make any difference. I take a year to be 260 trading days.
Hurst used Fourier analysis because that’s what he had. But Fourier has lots of problems, requiring large amounts of data and being unable to distinguish between two close cycles. Better methods have been developed, including Maximum Entropy Spectral Analysis, or MESA. MESA needs less data and can sharply distinguish between close cycles. Furthermore, it can detect a cycle given only one or two instances of it. So I chose to use a MESA program. But can it reproduce the cycles found in “Profit Magic”?

Yes, it can. With the exception of two added cycles, 2.5 and 13, it does a reasonably good job of finding the cycles that Hurst found. I think the added cycles harmonically fit. 2.5 = roughly .5 x 4.7 and 2 x 1.3. 13.1 = roughly 3 x 4.7.
So we can trust MESA as a method and confirm Hurst’s original findings. Hurst found a Principle of Proportionality in his work with Fourier, in that the longer the cycle, the more amplitude. However, cycle amplitude in MESA does not always follow that. I have chosen a nominal model by using only high amplitude cycles.
Now we can move on to test 1990-2015. Here’s what MESA says:

Now the nominal model is just five cycles, two larger ones and three smaller ones. The 16.87 is probably a shrunken 18.1. The odd 13.85 is still here. There is 1.2, .86 and .23 years on the small side. It is hard to see harmonicity. .86 is roughly 4 x .23. Sort of. But the theoretical .46 year cycle is just missing. And 1.2 is kind of 6 x .23 but there is no 3 x. The middle cycles of 4.7 and 9 are missing and two other cycles of about 2 and 3 are there but weak and don’t make it to the nominal model. All in all, a mess. But it does confirm what you see visually looking at the data – small cycles riding a big trend.
So what are we to make of this? This result stems principally from my decision to start my data series in 1990. I believe that beginning approximately at that time, markets began to behave in a way markedly different than before this time. Accordingly, I believe stock market analysis should not use data approximately before 1990. Other people have noticed this also. I recall one estimate placed the change as 1987, the year of the peculiar short crash.
If you don’t agree with me on this point, and you use data previous to 1990, then you obviously get a different result. For example, many analysts use “postwar” data, everything after about 1945. I suspect that if they were looking for a nominal model, it will resemble Hurst’s a little more and mind a little less.
But what is the difference to actual trading? The answer is, very little. Most traders only consider cycles of 18 months or less. These are somewhat changed today from Hurst’s nominal model, but they are still there and active. The fact that there is a vast vacuum beyond 18 months should not affect anyone’s actions. What might make a difference is the increased trend. If anything, the possibility of making large amounts of money has increased. The country has already noticed that the rich are getting richer, mostly in the stock market.
The message is this: we cannot take any nominal model for granted, and that probably we should search for an updated nominal model every year or two.

16 thoughts on “Revisiting the Nominal Model.”
Hi Gary
great to see you shaking some “sacred cow” !
Hurst Nominal(s) Models
Fact is there are 3 Cyclic or Nominal “Model(s)” we can find in Hurst works
a) – the Nominal Model described Chapter 2, page 33 of his book « Profit Magic of Stock Transaction Timing” published in 1970.
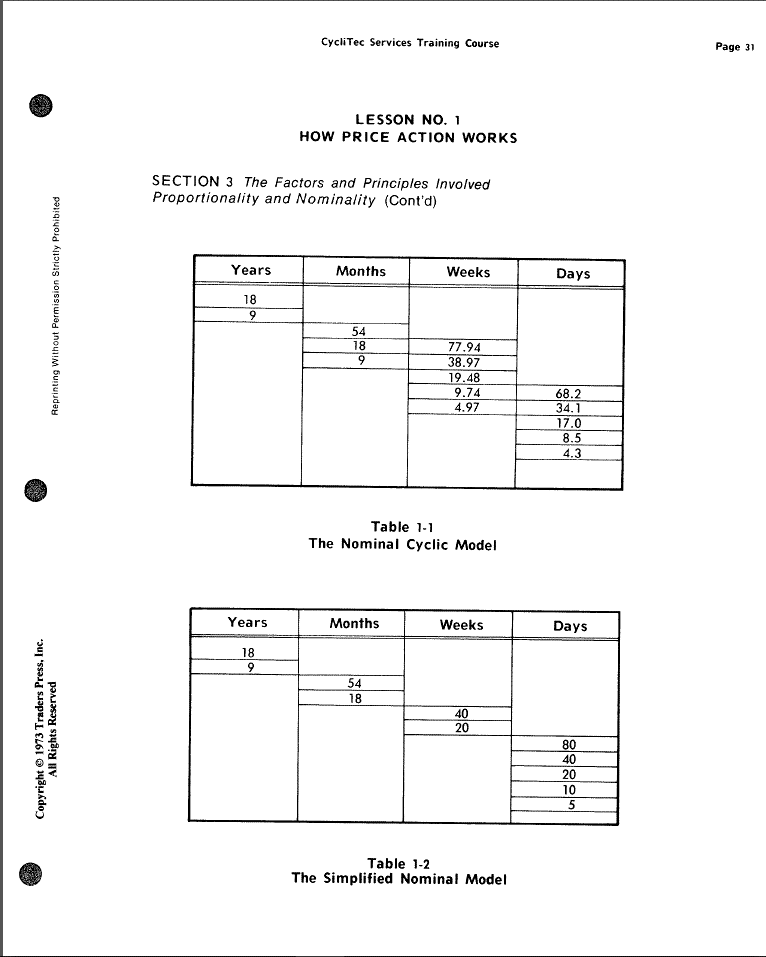
b) the Nominal Model described in the Course published in 1973 / 1975 by his service to investors named Cyclitec.
Lesson N° 1 – How Price Action Works – page 29 to 33
c) the Simplified Model used in the same course
why 3 “Models” ?
what are the differences ?
did Hurst explained the slippage from one “model” to the others ?
The Nominal model in Profit Magic – 1970
Hereunder you will find the same initial ” Nominal Model” expressed :
– in calendar days (CD) (I have not taken into account the bi-sextiles years)
– in theoretical trading days (TD) (5 trading days (TD) per week
– in “real” trading days based on an average annualized count issued from a study of an american trader rounded to 256 Trading Days (TD) .
I use also this “average” – 256 TD – for my time scaling in my Gann Studies .
Hereunder you will find the Nominal Model described in the Cyclitec Services Course
Hereunder you will find the ” Nominal Model” listed in the Cyclitec Course expressed : – in calendar days (CD) (I have not taken into account the bi-sextiles years) – in theoretical trading days (TD) (5 trading days (TD) per week – in “real” trading days based on an average annualized count issued from a study of an american trader rounded to 256 Trading Days (TD) .
If you compare both Nominal Models the difference between the initial Model of Profit Magic and the Nominal Model proposed in the Cyclitec Course, you can observe that :
– the 3 years Cycle,
– the 1 year cycle .
– the 6 months cycle
– the 3 months cycle
have disappeared without explanation
Then you observe the appearance in the model of cycles expressed in days
The Simplified Model (for the Dummies)
The same “Simplified Model” expressed in calendar and trading days
Great post Gary. You are attacking an issue that many Hurst analysts should be wrestling with. And the demarcation point, pre and post 1987 to a different market dynamic makes sense. I wonder if it is the plunge protection team (the PPT to many traders) that is responsible in part to the post ’87 character in the market. And the long trending moves have certainly been supported by the FED. But nonetheless, we do our best to navigate these markets.
cheers,
john
Fascinating post, thank you Gary. I look forward to trying out some new nominal models!
Hi Gary,
Thanks for your thoughtful comments. I take this model in the figure. It is rooted in a weekly rhythm (for the original 10d cycle) on the short end, and it recovers the 0.43 radians per year (for the orgininal 18y cycle) that comes out of a frequency analysis for e.g. DJ30 or SP500 at the long end.
Best,
Huub
From Tony Plummer ” The law of Vibration”
From Tony Plummer ” The law of Vibration”
This is an excellent piece. Thank you for posting it. As a neophite to Hurst analysis but an experienced market analyst and trader, I have found the adherence to Hurst’s original nominal model for longer cycles unusual and confusing. There are a number of cycles in the U.S. stock market that are statistically significant with a high amplitude over the period from 1990-2015 that do not correspond to the nominal model. It was great to see an experienced Hurst analyst confirm this. To me, the change in markets started in late 1994 and was primarily due to easy Fed monetary policy (maybe we should call them bubbles instead of cycles from this point on). In fact, using the eyeball test, the period from 12/94 to 3/09 looks like a giant “M” shape that David often draws. Regardless of the long-term picture, Gary’s conclusions make a lot of sense to me. Long-term cycles shouldn’t impact your day-to-day trading and there is a lot of money to be made in these types of markets.
Hurst developed a “price motion model” with a composite model line that reproduced the closing prices within 1%, see the excerpt. Thát is the point. I never got the .3676 rad/yr, also for >100 years of data and using the output of ST from the “show analysis summary” panel (weekly), the longest cycle is ~0.43 rad/yr, nothing beyond that, really.
Quote :
The practical result of this kind of variation is that the nominal cyclic model is useful (as are all the rest of the basic cyclic principles) as a necessary guide —but a specific, or current, cyclic model must be tailored to each issue in the process of analyzing a trading situation.
Hurst Course – Chapter 1 – How Price Action works