Hurst’s Principle of Variation tells us to expect that cycle wavelengths vary from their average length, resulting in a dynamic and constantly changing cyclic model. Hurst never discussed by how much a cycle wavelength can vary, and there are times when we cannot say for certain what the magnitude of a particular trough is.
There is a narrow band of uncertainty between any two cycles, where a trough could reasonably be the trough of either one of those cycles. For instance if a trough forms between 45 and 51 days after the trough of an 80-day cycle, is it a late trough of the 40-day cycle or an early trough of the 80-day cycle? Or is something else happening?
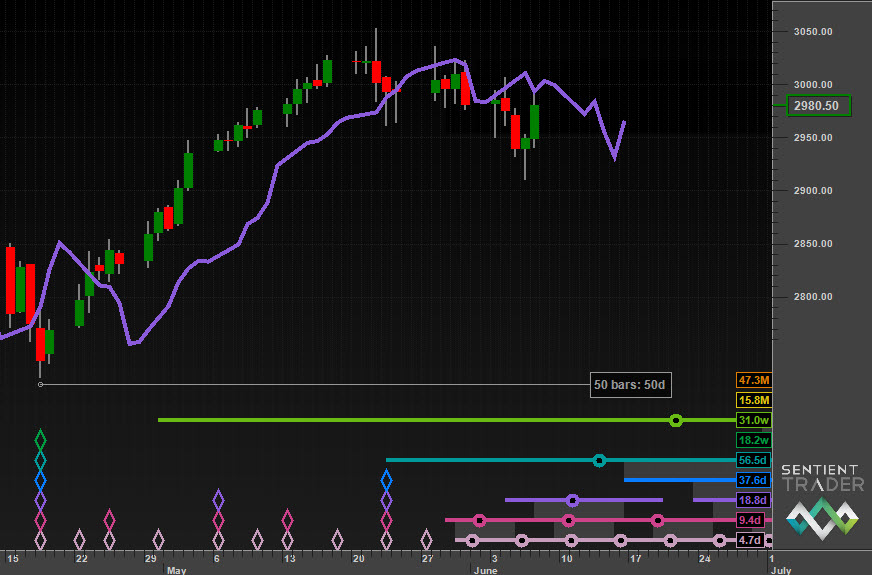
I have noticed an increased frequency of the formation of troughs in this band of uncertainty in the US markets over the past 18 months, in particular at the 50-day/100-day point, as this chart demonstrates:
This is what I mean by the 50-day puzzle, and it happened again this week, with a clear trough forming at 49 days since the 20-week trough of 18 April 2013. There are four possible solutions to the puzzle:
- The trough is a late 40-day cycle trough
- It is an early 80-day cycle trough
- It is the trough of a 20-day cycle, following a 40-day cycle trough which formed on 23 May 2013 (the 49 days consist of a 40-day cycle and a 20-day cycle)
- Or the nominal model we use should be modified to include a 50-day cycle (and a 100-day cycle)
As you can see from the analysis below, Sentient Trader has chosen solution 1 on the S&P 500 and solution 3 on the Nasdaq, but it is a good idea to bear in mind that the other solutions might well be playing out. Solution 4 is an interesting idea, one that would require several posts to explore (as a matter of interest if you are a Sentient Trader user, consider building a custom nominal model).
S&P 500
Here is solution 1 to the 50-day puzzle: The 40-day cycle is forming a late trough:
Nasdaq
And here is solution 3: The recent trough is a 20-day cycle trough:
Note the 20-day FLD which is plotted on both those charts (the purple line). The correct answer to the 50-day puzzle will most probably be revealed by the way in which price interacts with the FLD.
Euro/US Dollar
As discussed last week we are on the downward side of the current 80-day cycle in the Euro/US Dollar. This 40-day cycle is expected to be less bullish than the previous one. A new high was made this past week, but if that is the peak of the current 40-day cycle then it will have been an early peak, which will result in a more bearish cycle shape.
Gold
In how many ways can I express that the 40-week cycle peak forming in Gold at the moment is expected to be disappointing?
30 Year US Bonds
Bonds are in the grip of a dominant cycle pulling price downwards from the 40-week cycle peak of 1 May 2013. A 40-day cycle peak should be forming now, but it will probably be difficult to identify because of the strength of the dominant cycle.
Crude Oil
Crude Oil is presenting its own 50-day puzzle, (a 46-day puzzle to be exact). You can see here which solution I believe is correct:
US Dollar Index
The US Dollar is on the downward side of the 20-week cycle, and you can see how what started out as a promisingly bullish cycle has turned nastily bearish.
I would be very interested to hear which solution to the 50-day puzzle you believe is correct at the moment in the US markets.
Have a great week and profitable trading!


3 thoughts on “The 50-day Puzzle – 8 June 2013”
David,
Looking at the chart for gold brings up a question that I’ve been trying to understand. Seeing gold, we can see that the last few 18m cycles were running ~20m, but then after the top we saw the cycle peaks shorten down to about 13m. That is a fairly large change from cycle to cycle, but it would make more sense to me if one was a late peak in Sep 2011 and an early peak in Oct 2012. But that would only make sense if the toughs are synced and not the peaks. Even using tough sync, the latest 40w would only have been a 2-3 week rally and would be showing a deep decline into a 4.5y low toward the end of 2014. Do you think that synchronization could switch from peak to tough and back depending on the stresses in the market?
Time for more vacation
David,
You have already identified the solution to the “50 day puzzle.” One must create a custom nominal model with accurate wavelengths. I accomplish this by using the same bandpass filter that Hurst used in Profit Magic. It extracts the price waves very accurately making it a simple matter to calculate the average or standard deviation of the wavelength caused by the amplitude modulation of the included frequencies over several oscillations. I then created a custom nominal model using the average periods of the extracted waves which results in much more accurate phasing than the default nominal model.
William