Hello all
I’ve been kindly asked by the ST team to reproduce my comments in the Hurst Signals’ chat over the US SP500 index whereby I introduce the long term picture down to the recent price action, here they are:
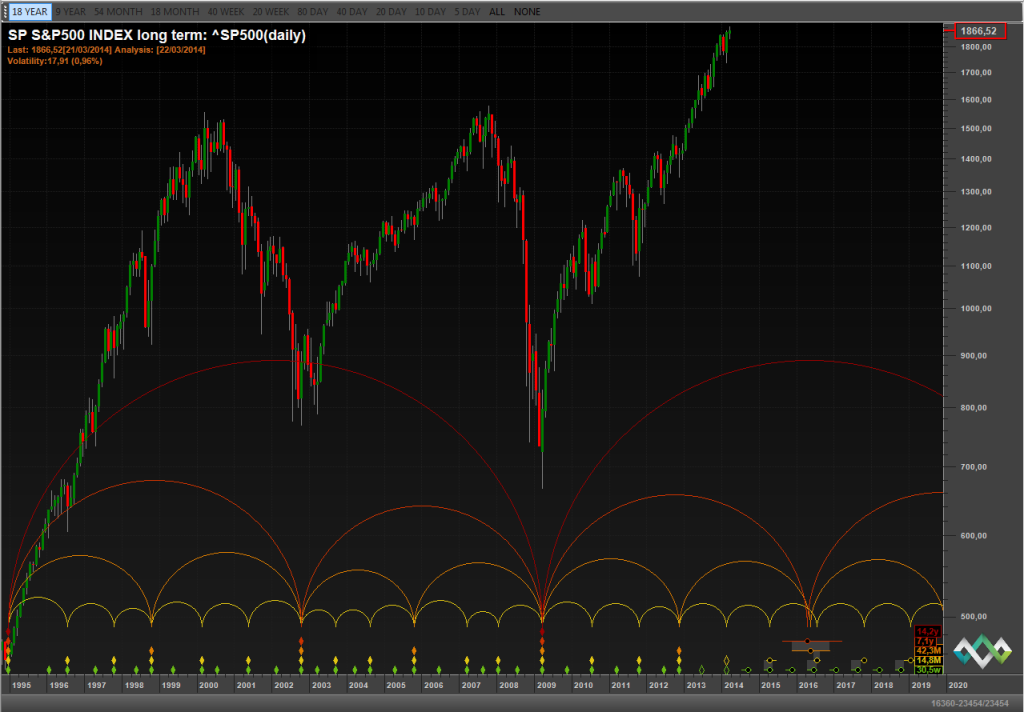
I’m currently on extreme alert due to a potential major, major top is forming in the US markets. For illustrating this vision I enclose a long term picture of the SP500 in a monthly basis. In this model it is assumed that cycles are running short in the last years but it seems to fit perfectly with the market action.
When I say major, I envision that the current nominal 18 years cycles (running around 14 years) is topping, but I’m wondering if something bigger is also topping, something that includes these two 18y cycles…
I have zoom it to recent price action since the 2009 low, I enclosed a weekly chart. Please take a look, in this model, how the cycles shorten… this is what I think is behind the short 80 day cycle running around 60 days
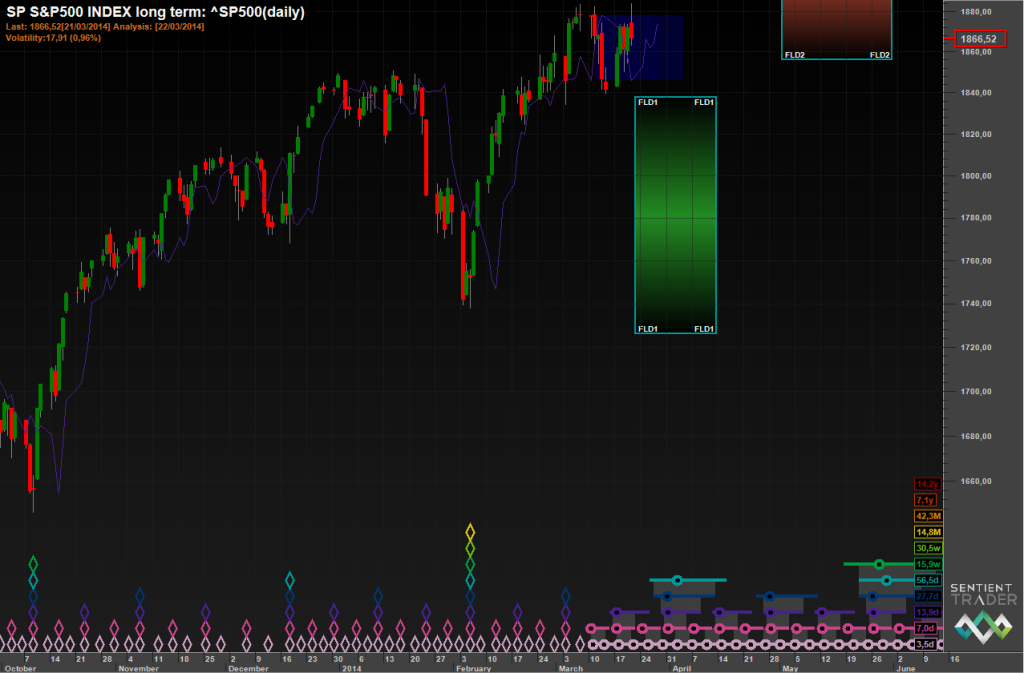
Finally, here us the most recent action, where we must focus on what it is important for us, the 80 day cycle and the 20 day FLD interactions.
In my opinion, we have passed the 40 day cycle last 3th of march, and that we have seen a G interaction…. If all of this stuff is correct, I’m preparing for a quite bearish week next.
In any case, good luck and have a nice weekend
Best
José


One thought on “A never ending story?! – 23 March 2014”
Very interesting information. Thank you.