In February this year I was studying a long swing trade for natural gas (/NG Henry Hub). Here is an email I shared with David Hickson and some others privately:
I would like your opinion on a trade I am studying. I know you will think it crazy to be looking at the natural gas market, but a long setup is brewing based on cycles. The first premise is that natural gas works on the same cycles as oil, but has different phasing in the long term cycles. The second thing is that when you study natgas, it works really well on a peak cycle view. So here’s the setup.
On a very long view, the last 11 year peak for natgas was 2006. So potentially a smart spike in natgas would arrive approximately 11 years later or towards 2017. There has to be many months leeway either side for this coming peak. Working off the previous 33 month and 66 month peaks (very consistent), we are due a natgas high late 2016 or into 2017. Natgas would be much more bullish than oil. The 11 year peak for crude (same cycles as natgas) is only due in 2019.
The short term view is as follows. This week is 8 weeks now off the Dec. low. If bullish, a low should ideally be made here shortly. Then price should rally up into a 16 week cycle high due April/May (see daily chart). We would need a cross of the 16 week FLD (green line) to signal a buy and that this trade might work. Of course there is risk of a retest of the lows. But I think this is something to watch. I’ve attached a natgas bat pattern which allows more downside here near term.
I have not blog posted but plan to soon if this scenario looks encouraging. If oil bottoms here in the first quarter, natgas downside should be limited. I think I have heard that before.
There has to be a fundamental shift to fuel this move. This year’s target may only be $3.00 – 4.00, but something has to get it moving. Fundamentals are pretty bad.
So you can see that I was eyeing up a trade without much conviction. I never got around to posting the analysis back then. I did take some exposure to this trade with Jan 2017 UNG calls and some natgas stocks. I am approaching the point of closing the remaining positions as this market achieves its objectives. Here is an updated view on the model and timing for the projected peak.

The coming peak is expected to be the synchronized peak of at least the 66, 33, 17 month cycles and so on down that is shown in the chart above. The next larger cycle up which is the 11 year (2:1 harmonic) could also be making a peak. This is a fairly important peak for natgas and the expectation would be for it to settle back down in a meaningful way. A complete retest of the lows in the coming year would have to be expected. In fact a good short trade is setting up here off this major peak.
A closer look at the daily cycles here suggests an initial peak as early as next week but this could be followed by one more final move up into November or December. The timing here cannot be that precise when such large cycles are involved. However, these cycles have been very consistent and a peak for natgas would have to be expected before winter starts in North America. The 33 month FLD suggests a minimum target of 3.60 and natgas is almost there now on a cash basis. I expect this target to be met and likely be overshot given the very large cycles involved. Momentum is picking up in the sector and speculation should lead to a final high in the coming weeks. I should also mention that the 66 month FLD (orange) is shown in the chart above. This FLD is drawn with a 33 month offset from price, and its now mirroring the peak of February 2014.

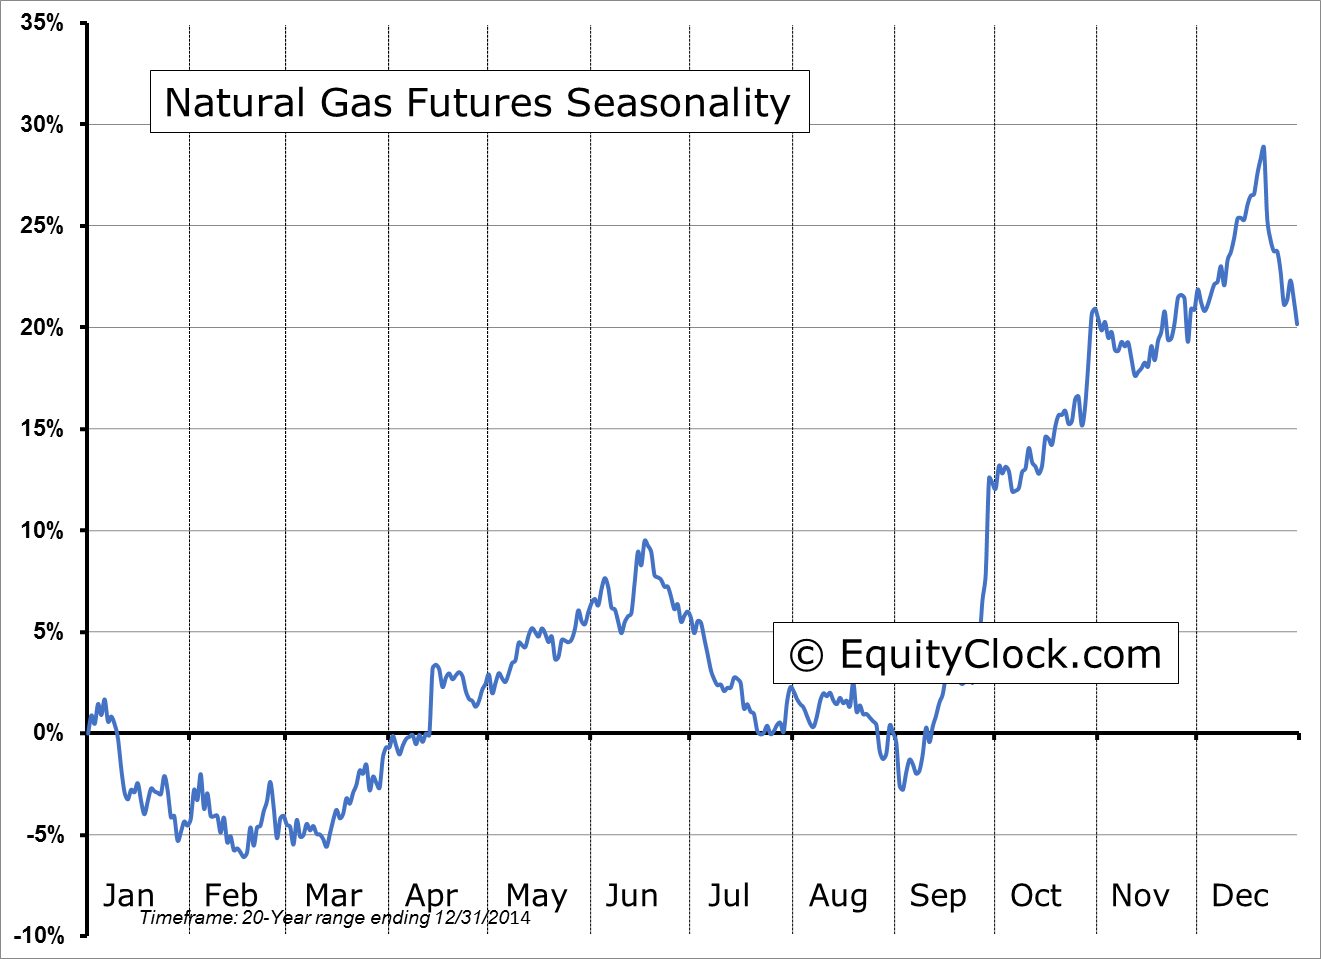
Seasonal trends are also in play and have been working very well for natgas. I was reminded this weekend at the CSTA Technician’s Day that natgas is in midst of its best seasonal period which carries late into the year. Chart courtesy EquityClock.com.
One of the most important points to understand here is that with the Hurst cycles method and the right analysis, you are given a time frame to get active and look for trade setups, whether long or short. What I like most is this approach gives you a view on what is around the corner. GLGT.
cheers,
john

8 thoughts on “Natural Gas (/NG and /QG)”
Thanks for this John, Natgas is one of my favourites to trade over the last couple of years. A good long entry into the trade described above was on a downward VTL and it has not disappointed since. Do you use a trough phasing in addition to the peaks? I find on the majority of instruments I look at using both trough and peak phasing is hugely beneficial.
Hi David,
Thus far I have focused only on peak analysis for NG. There is a very large cycle due to bottom sometime in the coming year. If I had a longer day set I would be starting to focus on both a peak and trough view.
cheers,
john
Thanks for the analysis John. Coincidentally, I went short on NG last week and have been enjoying the huge sell off! But I see lots of support just below the current price, down around the 2.80 mark, and your analysis confirms my own that there’s still more room to the upside and likely to be another rally or 2 before a new down cycle begins in earnest.
I am not yet a Hurst Cycles technician but am learning and watching. Thanks again for the great post.
Hi Ned,
Nice trade. One thing I watch is the relative performance of the futures price /NG vs. say the ETF UNG. The futures contract has now declined ~15% off the mid-October high, while UNG has only declined 8%. That signals to me to be wary of any obvious support here as I would really like to have seen UNG positions given up, but rather someone is hanging on. If there was a purge in UNG, I’d look again for the long side. GLGT.
cheers,
john
PS. If somehow the projected high has already been seen here, then the price target for the 33 month FLD (~3.6) was undershot which is not bullish …
Further to my comment today, I’ve updated the Sentient Trader peaks analysis as of Friday’s close. The short term phasing has changed slightly and now the peak on October 13th may have been more significant. TWT. However, we look at the status of various Hurst cycle periods that I follow for the nominal model used for natgas. In summary:
11 yr _ is _ 10.84 years along
66 mo _ is _ 64 months along (last cycle period was 65.9 mo)
33 mo _ is _ 31.6 months along (last cycle period was 32.5 mo)
16.5 mo _ is _ 16.9 months along (last cycle period was 14.8 mo)
34 wk _ is _ 40 weeks along (last cycle period was 33.4)
17 wk _ is _ 22 weeks along (last cycle period was 17.6)
Notice how all the timing bands for the cycles listed above are projecting a peak now at the mid-October high (look at the top of the chart and observe the timing bands). Appreciate also how the timing band for a high is very, very close for the 16.5 mo cycle up to the 11 year. And how the shorter term cycles such as the 17 and 34 week cycles are well past due. I’m completely flat this space. GLGT.
cheers,
john
Hi John,
I don’t know how to copy and past into this comment box so try to have a look at Stockcharts.com for the $NATGAS symbol weekly.
Price has recently challenged, and been rejected by, the 200 sma. I believe this is a widely recognized TA tool and has plenty of eyeballs. This Thursday’s price gap created a large hammer on the weekly. It appears from a vanilla TA perspective that there will need to be several challenges to the 200 sma before it is breached to the upside. Since we have had a 7 month uptrend from a major low in March the odds are quite high that a correction or sideways market is due. I’m not trading Natgas at the moment but if I was I would be looking for a swing trade switching strategy 5-10 days using HNU and HND with turn points at 3.30 (sell) and 2.75(buy).
The second tool you might want to use is Freestockcharts.com…symbol HNU or UNG or UGAZ or any other cousin
Try the TIME SERIES FORECAST Indicator on a 2 hour price chart. Edit the Forecast Tool to 55 periods with 8 Forecast Bars.
The short term cycles are tracking religiously. Swing trades are averaging 8-10 days.
Cheers…Ted
Thanks for the comments Ted. Nice to see you here. I don’t trade natgas much on short term timeframes. I like to play the gas stocks and on a 20 or 40 week cycle basis (actual cycles are a bit shorter). I’ve played UNG calls this year.
The thing to understand about this analysis I posted is the following. The peak we’ve now seen is likely the one I was looking for and it is a 66 month peak and very likely an 11 year peak. The last synchronized peak like this was in 2006. We should see new lows for natgas into next year. So I don’t think this will be a good market to trade unless you are focused on shorts. There will be a time eventually when natgas will start a brand new bull market. But my read is that it will take at least another year or more. GLGT.
cheers,
john
More than 4 years have passed.
Let’s look at your forecast.
An analysis of your graph shows that there is not a single hit on the target.
What’s the point in building a long-term forecast ??