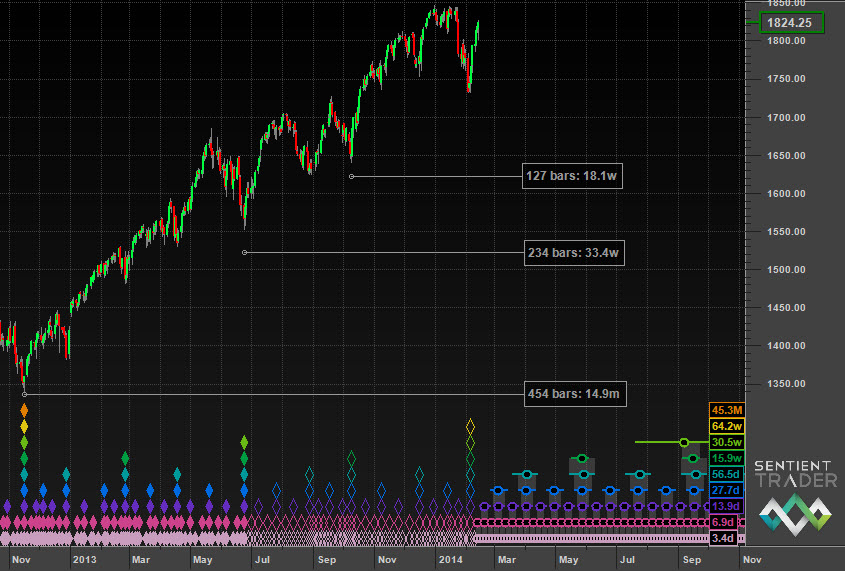
Now that the U.S. stock indices have gotten past the distortion in the charts caused by the fundamental interaction of the Brexit vote, they seem to be settling down back into their normal (?) cyclical patterns. The 4 year price wave has formed a low for the umpteenth time according to the spectral parameters set out by Hurst in Profit Magic (see chart below). The amplitude of the wave is low, relatively speaking, and the trend underlying the wave, while still positive, is exhibiting a decreasing rate of change. The 80 week wave (not shown) is cresting and the 20 week wave (not shown) is cycling down so there is not a lot to talk about. The only thing I’m really curious about is the degree to which the 80 week wave affects the price action. That will take many weeks to play out.


5 thoughts on “Textbook Hurst”
Hi William,
I’ve been following your articles here @hurstcycles for a while but I’ve never posted a comment; now I’ll write my first one !
It’s just a question: I’m wondering how have you obtained the smooth very cyclical (almost a perfect sinusoidal) yellow line overlaid the (white) bandpass line.
Using MetaStock and after many attempts I’ve reached a good result in cloning your yellow line but I’m a little curious which is the actual idea behind that sinusoidal; to me it seems as you could have been using a parabolic (bandpass based) or a no-linear regression line… obviously I’m supposing the bandpass is the delta of two cyclical median average (or better two linear regr lines).
Thanks for answering and keep up the good work.
Cheers
Marco
ps: sorry for my English… it’s not my native language
Hi Marco,
The output of the bandpass filter (yellow line) is simply the difference between two lowpass filters. The output of the highpass filter (white line) is simply the difference between the data points (monthly closes in this chart) and a lowpass filter. I merely plot them on the same chart for a visual reference as to where the high or low close occurs relative to the cyclical high or low of the price wave (filter output). Hurst provides a detailed explanation of this process in Profit Magic.
William
William ,
Just o at a quick glance it would appear that when the bandpass amplitude is muffle the market seems to continue to climb and with less significant corrections.In my analysis the 14 month, 42 month and 7 year cycles are all up and seem to be restricting the level of correction we will see until those peak and turn. Your thoughts.
Hi Jeffrey,
You are correct in that it is always important to consider the trend (sum of all the longer waves) underlying a price wave and not just the amplitude of the wave itself. That is why a price wave can cycle down yet the price action can continue higher. It takes a little practice to juggle all the cyclical balls at once, but once you develop confidence in your analysis, the consistency of the cyclical nature of the market (particularly stock indices) is rather remarkable. A perfect example is the 42 month wave over the last 40 years.
And that my friend is why I do not use the 54 month cycle any longer . It just does not make sense to do so.