One of the reasons why I am skeptical that gold has started a new bull market (ie. multi-year) is the USD and its status. Currencies and gold work off amazingly similar cycles and thus three closely related instruments are gold, the USD Index and the CADUSD pair (Canadian Dollar). The cycles I am working with are essentially 4, 8 and 16 year cycles for all three instruments. And in essence, gold rarely moves in long term trending advances without a weakening US dollar as a backdrop.
Here is a long term monthly analysis of the USD Index. Note sixteen year highs were in 1985, 2001 and now we are approaching another into 2016-2017 for the USD Index.
Measuring off the 2001 high, we have roughly a 14-15 year time span to the 2015 highs, short of the typical 16 year cycle period. A second issue is that the 4 year high for the USD Index most likely arrived in 2013 and if so, the next 4 year high is likely still ahead.
The weekly chart looks as follows.
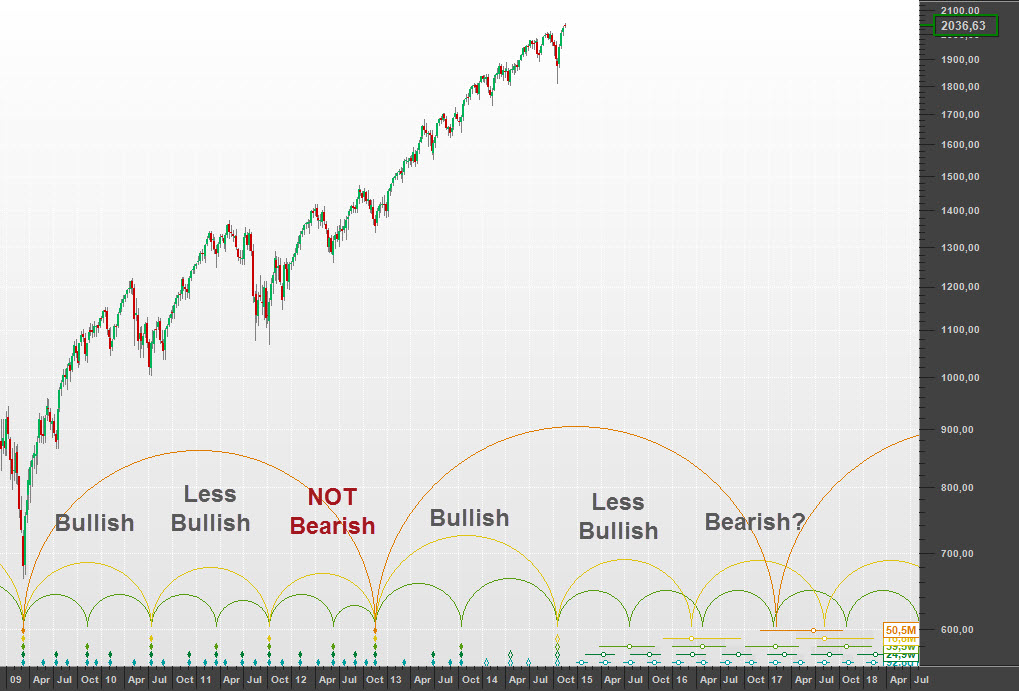
I should mention that I use two nominal 24 month cycles per 4 year cycle in this model and I find it helps to solve the peak analyses for gold and the USD Index. Looking at this second chart, it suggests that at least one more high is due for the USD Index (16 year cycle peak).
In the latest postings on gold we discussed the likelyhood of a 4 year cycle high for gold that was due imminently (by March-April). This is what a long term chart looks like if we’ve seen such a high. It doesn’t guarantee new lows for gold, but certainly a good correction is still due out of such a potential high. Here is the long term monthly.
And here is the weekly. Again a decline out of such a high is unpredictable in terms of targets, but new lows are very possible for gold. The burgundy line below price is the 16 year FLD. As suggested last month, this FLD is marking the timeband for the 4 year cycle high. It is not predictive to the week or month, but it is hinting that such a peak is due.
And finally we should look at the CDNUSD pair. The Canadian dollar is important to follow here for clues to when a new trending move has started for gold (and a major correction for the USD is underway). I’ll be watching to see if the Canuck buck can retest it lows this year (or next), before we see the 16 year lows for this currency. The last 16 year low for the $CDN was in 2001. In the analysis below Sentient’s initial cyclic model setting was used and three 16 month cycles per 4 year cycle resulted. If the $CDN makes a sustained break above the 16 month FLD, it would suggest long term cycles have bottomed. The January 2016 low seems early for this important trough and time will tell.
So in sum, I still expect an important top for gold and a correction to eventually test last year’s lows. And new highs for the USD Index are likely before a trending bull market can really get going for gold.
Good luck. Good trading.
cheers,
john


13 thoughts on “USD Index Long Term Cycles”
I have waited for this market to be available to trade for 20 years. I stayed at home also. Never sorry for that move. Had lots of time to look at markets. Cannot wrap my mind around shorting for some reason. Metals is a passion for some reason. Appreciate your work all the time and have been reading your posts for years here. AKA. swanstkdh
Look forward to all & any comments you make on ski gold. I think you are by far the most knowledgeable poster on that website. I’m a retired jeweler, sold my store and retired in 1985, moved to my farm shortly afterward, & am now living the good life. My very best to you John.
Thanks a lot for your analysis! Always very interesting to read them.
USD I agree. It looks like consolidation phase and one more push higher for a major top.
About gold – it will be a higher low. USD and gold tops/bottoms are not synchronized.
Gold made a bottom in 1999 and deep retracement with higher low in 2001 waiting for USD major top.
USD made a bottom in 2008 and deep retracement with higher low in 2011 and gold made it major top in 2011 before USD really shooting to the moon.
Expect the same – long sideway move or deep retracement for gold… or both.
On my blog I have posted my thoughts about gold. Interesting is I expect the next bottom in September-October like your FLD line.
http://practicaltechnicalanalysis.blogspot.co.at/2016/03/precious-metalsgold-miners.html
I noticed that for some odd reason Australian Dollar follows the same pattern.
Black Line is Gold/USD
Orange is AUD/USD
Green is CAD/USD
Does anyone know if there are other currencies following the same pattern?
Why would Australian and Canadian Dollar be seen as safer currency than USD ???
Here is the picture
Dear John,
Many thanks for your analysis!
There seems to be quite interesting possibilities to combine traditonal technical analysis and cycles.
I have some ideas and questions, what I would appreciate to discuss with you directly.
Please contact me on hurst@friends.ee
Thanks in advance,
Alo
Hello John.
Do you think Gold has now reached its 4-year peak?
Do you have any targets for the move down in terms of price & timeframe?
Hi Karni,
Gold looks like it is falling into a 20 week cycle low. That was expected and why I exited most remaining positions in March. The last spike up in the gold mining indices into Tuesday this week was NOT expected. So that leaves many questions. Was that spike a trap, or were miners leading gold for the next move higher? To be honest, I have no idea here for the coming weeks. I will probably have to buy a 20 week low for gold just to keep my hand in this trade. I will say I am very uncomfortable doing anything in this sector right now, particularly with giving opinions, because chances are I will be wrong. 🙁 I’ll try to have a closer look this weekend.
cheers,
john
The patterns look ok – silver is finishing wave 5 after a flat for wave 4, the miners – it was a thrust higher from a triangle wave 4 and wave 5 finishing the impulse from the bottom. So if you ask me it is a trap if some one wants to go long now.
The problem is Gold made lower high and it is in some corrective wave for a while. In May we will have have intermediate term bottom screaming buy, but on the other side only 2-3 weeks correction for this vertical move in the miners is way too short and on top of this we expect a rally for the USD to major top in the next 6-12 months, which means correction for PM/miners.
So – intermediate term bottom expected in a few weeks, strong vertical move so far and I think the high will be tested (higher high possible) after a correction, but because of USD expecting a correction probably for 6-9 months? This is the mess…..
I will shoot in the dark and say expanded flat – wave A now, wave B in summer higher high possible and strong move lower when the USD makes it’s major top. This will be one hell of a trap if it plays out:)
I do not feel comfortable to buy too, but I will keep it simple – 20 week cycle low expected and if we see only 3 waves lower it is a buy period. If I am wrong with the expanded flat I do not have problem making money being wrong:) and if I am right the move higher should test the highs and we will have enough time even to book some profits and not to be caught in a sell off.
That is the plan at the moment:)
Looks like Gold is setting up for a blow off move. We’ve seen a 20 week low, likely arriving early with the late March low. A sustained breakout in May is very possible looking at the miners. Its a trade. There are many signs that a commodity bull has started or at least an important bottom is forming. This bodes well for markets like the $TSX which was projected to make a major low in Q1 this year. That makes me wonder about the USD and its status. It is overdue for an important low and a new high late this year into 2017. If the $USD starts a trend move down from last year’s levels, we will see lots of inflation ahead into its next major low.
cheers,
john
Important low or even the low for the commodity bear is not a surprise. I wrote at the beginning of the year that the commodities should move higher and emerging markets which are commodity dependent will outperform. They all show very nice impulses – TSX,EWZ,RSX,USD/RUB, Oil, miners…..
So intermediate term it is correction time – finished 5 waves/market breadth divergences/ TA indicators divergences.
Gold blow off when all the rest are correcting? – I doubt it, best case double top(M pattern).
After the correction there should be one more leg higher – after an impulse another one should follow.
I think yields are at 4 year cycle low and should move higher for a year, USD should move higher for a year…. this should bring commodities lower before the mega bull, this is just the warm up:)
I do not see a reason to change my analysis, everything works fine EW,cycles,market breadth… have more faith in your long term gold and USD analysis:)
Of course if the USD index starts plunging below 92 it is over.
I like that. 🙂
Have a good weekend karni.
I will be buying this 20 week low in gold I think. I want to see a retest of the 54 month FLD which has formed the resistance to the recent rally. Looking at the miners does add confusion I totally agree. Still, worth a long on a VTL cross or FLD cross. Lets see how easily (or not) price approaches the high made early March.